

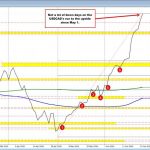
The USDCHF has been stuck in a relatively tight 80-pip trading range over the last five to six trading days. For a full week of activity, that’s fairly compressed price action. When volatility contracts like this, it often precedes expansion — meaning at some point the pair is likely to break and run. The key question is direction. Short-term technicals are beginning to tilt modestly to the upside.
Over the past three sessions, buyers have consistently leaned against the 100-hour moving average (currently 0.7696). Each dip toward that level has attracted demand. Notably, the 200-hour moving average sits just above at 0.7698, creating a tight band of dual support. The near convergence of those two widely followed moving averages increases their importance. As long as price holds above that 0.7696–0.7698 zone, buyers retain the short-term technical edge. A sustained move below both moving averages would shift the bias back to neutral or bearish and likely invite additional downside probing.
On the topside, resistance is defined by a prior swing area between 0.7729 and 0.7740. That zone has capped rallies during the recent range phase and represents the first meaningful hurdle. A clear break above that band would signal that buyers are beginning to take control of the range. If momentum builds above 0.7740, traders would then target the 38.2% retracement of the 2026 trading range at 0.7769, which stands as the next technical objective.
Key Levels
-
Support:
-
100-hour MA: 0.7696
-
200-hour MA: 0.7698
-
-
Resistance:
Summary Bias
The short-term bias is more bullish while price remains above the 100- and 200-hour moving averages. A break above 0.7729–0.7740 would open the door toward 0.7769.
Risk to the bullish view: A move back below the 100- and 200-hour MAs would weaken the technical posture and tilt the bias back toward the downside.


Leave a Reply