
Some of you have already seen this bull flag in oil in my previous oil technical analysis article, well before the war started over the weekend. But here it is again with a detailed technical explanation.
Remember, there is no “one single way” to do “technical analysis”. I use broad perspectives such as the ones belw with other technical analysis methods, including, for example volume profile analysis, order flow, and others. This is one perspective, not a crystal ball.
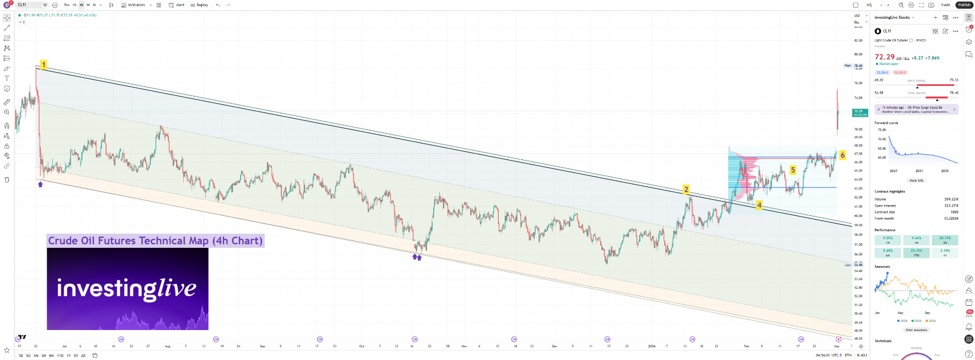
4h chart of the investingLive technical map on crude oil
Technical Analysis Primer: The Anatomy of a Reversal (Crude Oil)
To fully grasp why this crude oil move matters, it helps to zoom out and recognize a simple idea: strong reversals and breakouts rarely happen “out of nowhere.” They usually develop in stages, where the market first builds structure (a map), then tests it (a vote), and only then expands (a decision). Below is a clean educational breakdown of the most common patterns and principles traders and investors will see in this type of setup.
1) The Macro Bull Flag and Descending Channel (Points 1 and 2)
A bull flag is a continuation pattern that looks like a flag on a pole. First you get the flagpole (a sharp, impulsive rally). Then price cools off in a tight, downward-sloping channel (the “flag”), typically defined by two parallel trendlines.
What you are seeing on the chart
-
Point 1 marks the peak that starts the consolidation.
-
Point 2 and subsequent touches confirm that sellers are defending the upper boundary, while buyers keep stepping in on dips.
The psychology
This downward channel is usually not “bearish selling” in the bigger sense. It is often profit-taking and rebalancing after a strong advance. The reason bull flags can be powerful is that the pullback is controlled: price drifts lower, but does not collapse. That is the market catching its breath.
Extra context that helps traders
-
The “healthiest” bull flags tend to show shrinking volatility inside the channel (smaller swings, smoother drift).
-
A key tell is whether the market stops making fresh lows easily. If each push down gets bought faster, the flag is tightening like a coil.
-
Breakouts tend to be more meaningful when the flag occurs after a strong impulse move, not after a choppy grind.
2) The Cup and Handle Formation (Point 3)
The cup and handle is a classic bullish continuation pattern. The cup forms when selling pressure fades and the market rounds out a bottom, and the handle is a brief pullback or sideways pause just below resistance.
What you are seeing on the chart
-
Point 3 is where the rounded recovery becomes obvious, and the market starts pressing into the same ceiling again and again.
-
The handle typically forms just under the breakout level, often as a smaller channel, a tight range, or a shallow drift lower.
The psychology
The cup is the market transitioning from distribution to stabilization to accumulation. The handle is the final cleanup: it shakes out late buyers who entered too early and it invites short sellers to lean against resistance one last time.
A subtle but important detail: a “good” handle is usually shallow and controlled. Instead of being rejected hard from resistance, price hesitates and holds near the ceiling. That often signals seller fatigue and buyer confidence.
Extra context that helps traders
-
Handles that retrace too deeply often weaken the setup because they suggest sellers still have real control.
-
A “clean” handle tends to form with less urgency on the downside (less panic, fewer sharp sell bars).
3) Breakout and Retest: The Principle of Polarity (Point 4)
In technical analysis, the Principle of Polarity is a core rule: once a meaningful resistance level breaks, it often flips into support (and vice versa). Traders sometimes call this “old resistance becomes new support.”
What you are seeing on the chart
-
Price breaks above the channel or the key ceiling, then returns to test that level (the retest, Point 4).
-
The retest is the market checking: “Do buyers still defend this level now that it is above?”
The psychology
Many traders avoid chasing breakouts and wait for a retest because it answers a simple question: was the breakout real, or was it just a spike? A successful retest is basically the market confirming that the breakout level is now a floor.
What tends to separate strong retests from weak ones
-
Strong retests often show quick rejection of lower prices (buyers step in fast).
-
Weak retests often show price accepted back inside the old range (the breakout fails and traps late buyers).
4) Volume Profile and Point of Control (POC) (Point 5)
Unlike standard volume bars (volume per time), Volume Profile shows volume traded at each price level. The Point of Control (POC) is the price where the most business was done in the chosen period.
What you are seeing on the chart
-
A sideways consolidation forms.
-
The POC develops and sits near the top of the range, close to resistance (Point 5).
The psychology
A POC near the top of a range is often bullish because it suggests the market is not rejecting higher prices. Instead, it is accepting them as fair value. Put simply: buyers are willing to transact heavily near the ceiling, which can mean accumulation is happening without needing a deep pullback.
Extra context that helps traders
-
When volume builds at higher prices, it can create a “platform” of support. If the market breaks out, that platform can later act as a strong area for dip-buyers.
-
If the POC keeps migrating upward over time, it is often a sign that the market’s perceived fair value is rising.
5) The Breakout Expansion (Point 6)
A true breakout is not just a price poking above a line. It is usually an expansion phase, where price escapes the old balance area with urgency. This is often where gaps, strong momentum candles, and follow-through show up.
What you are seeing on the chart
The psychology
Breakout expansions happen when multiple groups are forced to act at the same time:
-
Breakout buyers enter on confirmation.
-
Short sellers cover (a squeeze effect).
-
Momentum systems trigger as volatility expands and structure breaks.
-
Fundamental headlines or weekend events can amplify this by forcing a repricing at the open.
A gap is often the market saying: “We are not negotiating in the old range anymore.” That does not guarantee continuation forever, but it does explain why the early phase can feel violent.
A simple way to tie all six points together
One clean framework that many professionals use is Balance -> Break -> Acceptance -> Expansion:
-
The flag, handle, and base-building are the balance.
-
The breakout is the break.
-
The retest and polarity behavior are the acceptance test.
-
The surge and follow-through are the expansion.
What a breakout in oil. The tehnical story was there.
That is the anatomy. Once you learn to recognize these stages, a chart stops looking like random noise and starts looking like a sequence of decisions the market is making.
It is not only me watching oil prices and you are probably reading this for the same reason. But I just wanted to also give you some good ‘ol simple technical analysis education, if I may.
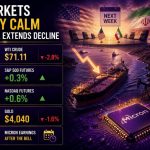
In addition to educaton and to the disruption in the oil market, you probably already know that crude oil prices gapped significantly higher as markets priced in a steep weekend risk premium.
Despite the volatility, the European Union has maintained a measured stance, with officials stating there is no immediate impact to oil security resulting from the current U.S.-Iran friction.
The geopolitical uncertainty also spilled over into digital assets, prompting a fresh technical analysis of the crypto market as investors look for hedges against traditional market swings. Amidst the chaos, a potential path toward de-escalation emerged as Trump floated the idea of lifting sanctions should a new Iranian regime take power, offering a glimpse of a shifting diplomatic landscape.
Stay tuned with investingLive.com


Leave a Reply