

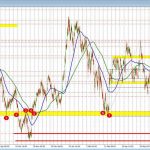
While gold traditionally serves as a “flight-to-safety” asset during crises, the current price action is defying that playbook. After failing to clear key overhead resistance yesterday at the topside channel trendline (see video from yesterday), a breakdown at the $5,240–$5,250 confluence zone triggered significant selling momentum.
This bearish move has systematically cleared several critical support levels:
-
200-Hour Moving Average: $5,171.71
-
61.8% Fibonacci Retracement (2026 range): $5,141.61
-
Key Swing Level: $5,116.73
The Road Ahead
The focus now shifts to the $5,000 “psychological” level, which aligns with the 50% midpoint of the 2026 trading range. This acts as the ultimate line in the sand for bulls. A sustained break below $5,000 would signal a decisive shift in market structure, handing short-term control firmly to the bears.
In this environment, the macro “crisis” narrative is secondary to the charts. For traders, staying disciplined with these technical levels is proving far more profitable than following the traditional playbook.


Leave a Reply