
The USDCAD has been grinding higher, extending the bullish momentum that followed Monday’s volatile price action. Earlier in the week, the pair surged to test the March high at 1.3752, only to find sellers after headlines crossed that Trump was backing off threats to strike Iranian energy infrastructure. That shift in tone triggered a sharp intraday reversal, with price tumbling to trendline support before rebounding into the close.
Since then, the technicals have taken on a more constructive tone.
During yesterday’s session, the pair found reliable support at the rising 100-hour moving average, holding that level on three separate tests. Each dip attracted buyers, reinforcing the idea that short-term participants were leaning against that MA as a risk-defining level. That base helped fuel a break above the March high during the US session, signaling that buyers were beginning to reassert control.
There was a brief wobble into the close and early Asian trading, with price slipping back below the early February high. However, that move lacked follow-through. Buyers quickly stepped back in, and the pair resumed its push higher—ultimately reaching fresh highs not seen since January.
But now comes the real test.
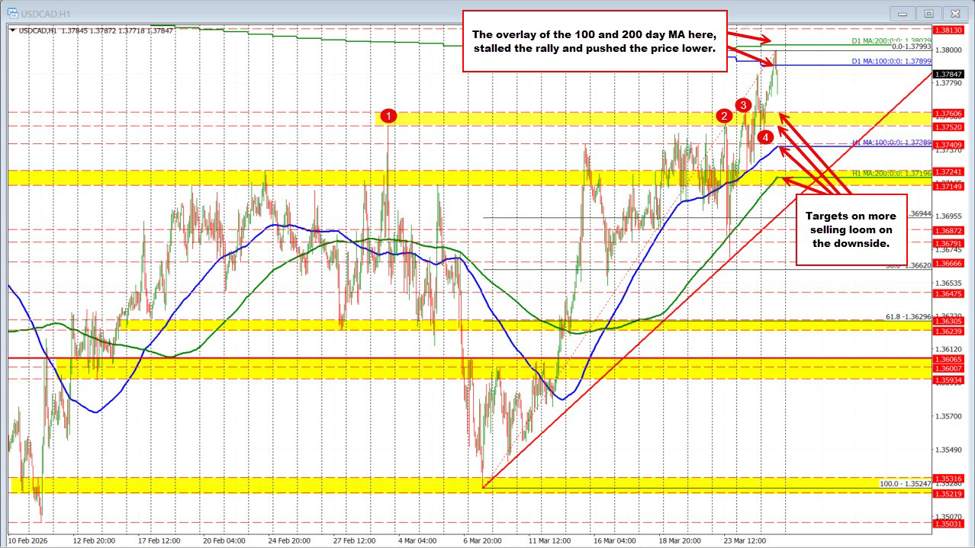
As the price extended higher, it ran into a cluster of major resistance, including the 100-day moving average at 1.37899 and the 200-day moving average at 1.38029, with the psychologically important 1.3800 level sitting right in between. That tight grouping created a formidable ceiling, and not surprisingly, sellers leaned against it on the first test, stalling the rally and prompting a pullback.
This is where the technical battle is clearly defined.
For the buyers to maintain control and build on the recent upside momentum, they need to break above and stay above that 1.3790–1.3803 resistance zone. Doing so would open the door for a broader bullish extension and signal that the market is ready to trend higher after weeks of choppy consolidation.
On the flip side, failure to get above—and sustained selling against that resistance—keeps the sellers firmly in the game.
On a move lower, the first targets come in at prior resistance levels turned support, including the March high at 1.3752 and the nearby swing level at 1.37606. A break below those levels would shift attention back toward the rising 100-hour moving average, now near 1.3738, which has been a key barometer for short-term bias.
So far, the daily moving averages have done their job on the first test, capping the rally and forcing a pause. The bullish bias has brought price to the doorstep of those key longer-term levels.
What next?
It’s now up to the buyers to prove they can overwhelm that resistance. Break and hold above—and the upside opens up. Fail—and the market likely rotates back into its familiar range, with the 100-hour MA once again acting as the line in the sand.


Leave a Reply