
- SaPrior was 622K
- New home sales change -7.3% vs -6.2% prior
- Sales 6.8% below the May 2025 level of 622,000
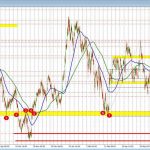
This is a terrible report and this series has been cratering since October. It looks like the jump in borrowing rates around the war halted new home sales in a big way. That should reverse with the war now (hopefully) over and oil prices falling. A hawkish FOMC is probably going to help the long end as well.
There is some variance in this report but the three-month average is now at the lowest since 2022 and the second-lowest in a decade.
The decline was concentrated in the West, which fell 26.9% on the month to 117,000 and was down 17.0% year over year. The South, the largest region by volume, slipped 4.1% to 350,000. Both other regions advanced: the Midwest rose 16.2% to 79,000, and the Northeast gained 3.0% to 34,000, the latter up 17.2% from a year earlier. On a year-to-date, not-seasonally-adjusted basis, national sales are running 7.0% below the same period in 2025.
Inventory continued to build. The seasonally adjusted estimate of new homes for sale at the end of May was 496,000, up 2.3% from April and the highest in over a year, though still 1.4% below the May 2025 level. At the current sales pace, that represents 10.3 months of supply, up from 9.3 months in April and 9.7 months a year earlier, and the highest months’ supply reading in the recent series. By stage of construction, completed homes accounted for 324,000 of seasonally adjusted sales, with another 192,000 under construction and 64,000 not yet started.
On pricing, the median sales price of new homes sold in May was $424,900, up 2.0% from April and virtually unchanged from the $424,800 recorded in May 2025. The average sales price was $540,600, up 7.8% on the month and 5.0% year over year. As with prior months, movements in the median and average reflect shifts in the mix of homes sold by price tier and region as much as price changes for comparable homes; the share of sales under $300,000 held near 15%.
The release reiterated the standard caveats: figures are seasonally adjusted annual rates drawn from sample surveys with wide confidence intervals. The May monthly change of -7.3% carries a ±13.3% band, so the headline decline is not statistically distinguishable from zero at the 90% level, and the agencies note it takes four months to establish a trend. The June report is scheduled for July 24.
US new home sales


Leave a Reply