
Yesterday, I walked through the broader stock indices—focusing on the NASDAQ and S&P—and at that time, the technical bias was clearly negative, with both indices trading below their respective 200-day moving averages. That level remains a key barometer for buyers and sellers, and staying below it keeps the longer-term bias tilted to the downside.
Today, however, sentiment has improved. Hopes for de-escalation in the Middle East have helped lift equities, but from a technical perspective, the picture remains mixed—and a bit fragile.
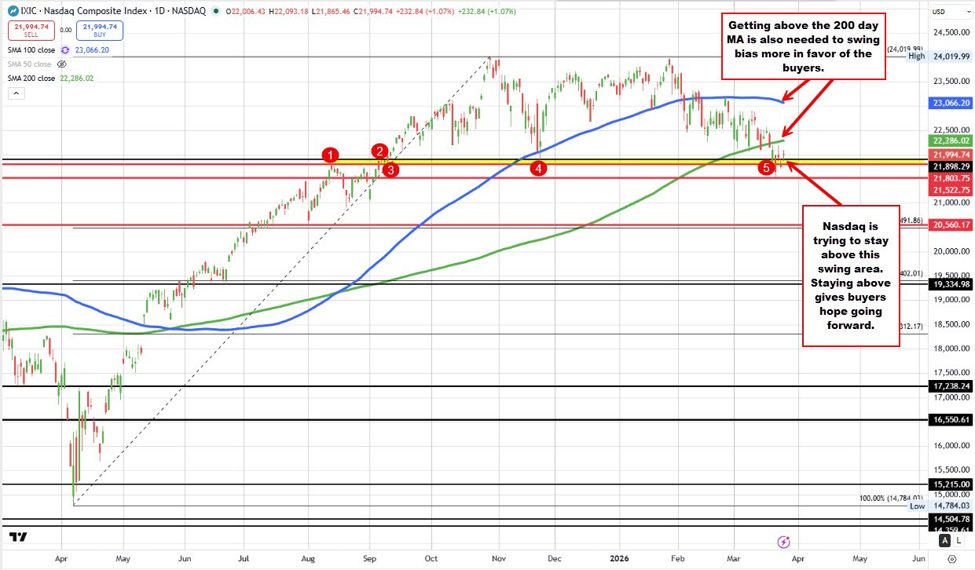
Starting with the NASDAQ, the index has now closed below its 200-day moving average for five consecutive days, reinforcing the bearish tilt. That moving average currently comes in at 22285.70, and importantly, today’s rally has not been enough to reclaim it. The high price reached 22093.18, still well short of that key level.
For buyers to regain meaningful control, they need to get the price back above—and keep it above—the 200-day moving average. Until that happens, rallies risk being corrective rather than the start of a sustained move higher.
That said, there is a constructive element developing on the downside. The NASDAQ has moved back above a prior swing area between 21803 and 21898, which had acted as support in the past. Although the price briefly dipped below the top of that zone earlier today (to around 21865), it quickly reversed higher.
Holding above that swing area keeps buyers in the game, but it’s a “work in progress.” The real test remains higher—back at the 200-day MA.
Turning to the S&P 500, the story is slightly different—but still mixed. The index had closed below its 200-day moving average for four straight days through yesterday. Today, the price did manage a brief break above that level (currently at 6630.85), reaching a high of 6633.94.
However, that break could not be sustained. The price has since rotated back below the moving average and is now threatening a fifth consecutive close beneath it.
So while the S&P showed early signs of strength, the inability to hold above the 200-day MA underscores the ongoing tug-of-war. If the broader market is going to turn higher, the S&P likely needs to lead by firmly reclaiming and holding above that level—which could then pave the way for the NASDAQ to follow.
The clearest signal today may actually be coming from the technology bellwether—Nvidia.
After closing below its 200-day moving average for three consecutive days, Nvidia has rebounded and is now trading back above that key level at $178.97 (currently near $180). If the stock can hold and close above its 200-day MA, it would give buyers more confidence and potentially act as a tailwind for the broader tech sector.
Looking ahead, the next upside target for Nvidia comes in at its 100-day moving average near $185.03. A break above that level would further shift the bias to the upside and help relieve some of the pressure that has weighed on the tech-heavy NASDAQ.
Bottom line:
- NASDAQ: Bearish bias below the 200-day MA, with support holding—for now.
- S&P 500: Mixed, with price oscillating around its 200-day MA.
- Nvidia: Turning more constructive, back above its 200-day MA and attempting to lead.
The result is a mixed and uncertain technical backdrop, leaving equity markets on edge. Traders are watching closely for the next decisive move—either a break back above key resistance to shift momentum higher, or another failure that reinforces the downside bias


Leave a Reply