
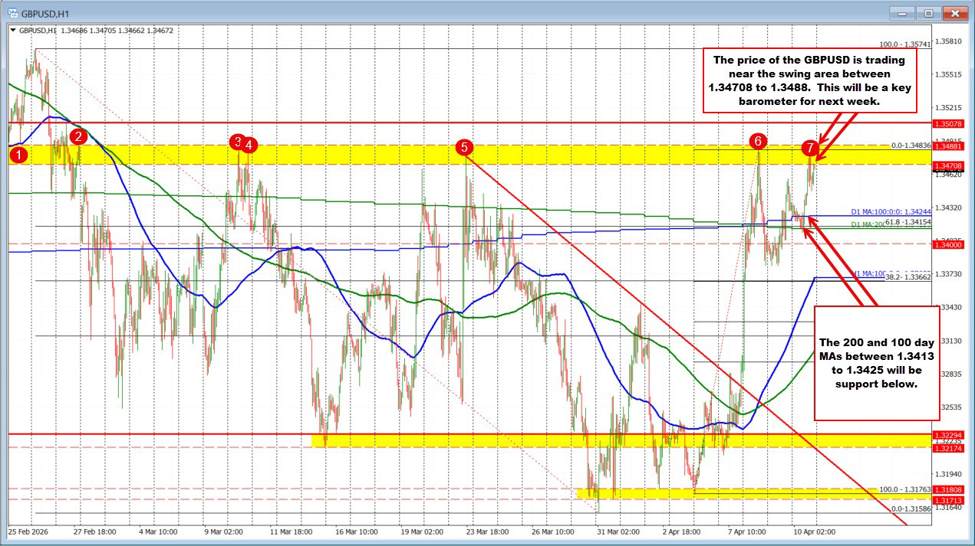
The GBPUSD is heading into the close trading near the lower end of a well-defined swing-area ceiling between 1.34708 and 1.3488 (see red numbered circles on the chart below). This zone has repeatedly capped upside attempts over the past six or so weeks, making it a key barometer for buyer conviction. Each test has attracted sellers, but the fact that the pair is once again pressing into the lower bound of that range suggests buyers are not backing down. If the price can build momentum and extend above the top of this ceiling area, it would signal a meaningful shift in control, opening the door for a broader upside extension as trapped shorts are forced to cover and momentum traders re-engage.
On the downside, the 100- and 200-day moving averages—clustered between 1.3414 and 1.3424—serve as a critical support zone. This area represents a classic “line in the sand” where buyers have recently leaned to defend the broader bullish bias. A move below that cluster would not only break a key technical floor but also tilt the short-term bias back in favor of the sellers, likely leading to increased downside probing as confidence in the bullish structure erodes.
Bottom line: The battle lines are clearly drawn. Resistance above at 1.34708–1.3488 defines the upside breakout zone, while support below at the 100- and 200-day moving averages defines the risk for buyers. With price squeezed between these levels, the pair is coiling into the close, and the next directional move will likely be driven by weekend headlines and how traders respond in the early hours of Monday trading.


Leave a Reply