
Key Technical Takeaways
-
Successful Defense: Gold buyers successfully defended the 100-hour moving average yesterday, using the dip as a buying opportunity to reignite the uptrend.
-
Current Momentum: The precious metal is trading up roughly $37 (+0.85%) on the day at $4338.31, with intraday highs reaching $4349.50.
-
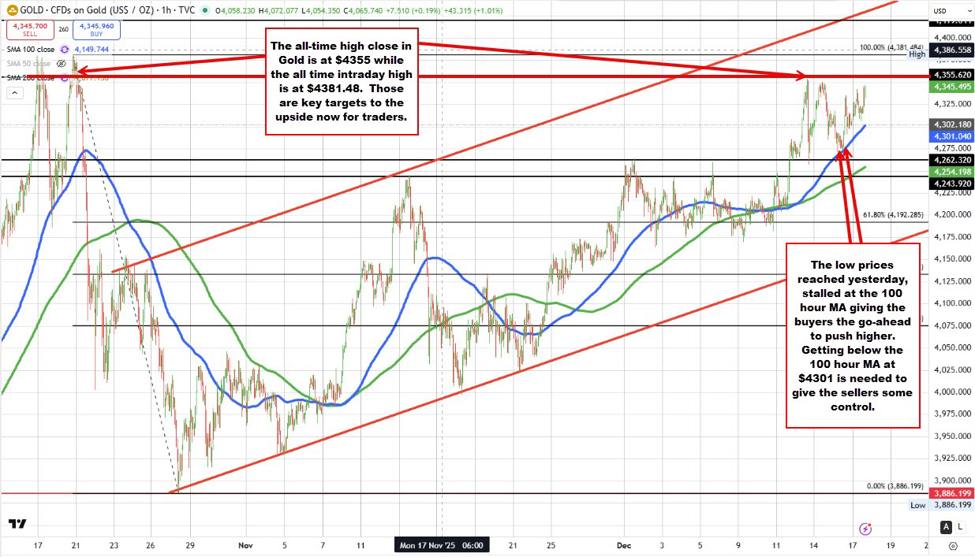
Immediate Upside Targets: Bulls are now focused on breaking the highest-ever daily close at $4355.62 and the intraday all-time high of $4381.84.
-
Trendline Resistance: A breakout to new highs brings a daily channel trendline near $4419.64 into focus.
-
The Downside Risk: The bullish bias remains valid as long as the price holds above the rising 100-hour moving average, currently near $4301.
Buyers Resurface: The Bounce Off the 100-Hour Moving Average
The current rally in Gold is a direct result of yesterday’s technical test. After a brief correction lower, the price tested its 100-hour moving average, a level that often acts as a barometer for short-term sentiment.
Sellers attempted to push the price below this key technical indicator but failed to gain traction. Instead, willing buyers stepped in against the level, defending the trend. This inability to break lower gave the “go-ahead” signal for bulls to re-enter, driving the price back up. As of today’s session, that momentum has extended, pushing Gold to a session high of $4349.50.
The Bullish Case: Mapping the Path to New Record Highs
With the 100-hour moving average firmly established as support, the path of least resistance appears to be to the upside. Traders are now watching a specific sequence of resistance levels:
-
Friday’s High ($4353.57): The first hurdle is the swing high from last Friday.
-
Highest Daily Close ($4355.62): Just above that lies the highest closing level on record, achieved on October 20. A close above this level would be a significant bullish signal.
-
Intraday All-Time High ($4381.84): Clearing the closing high exposes the ultimate target—the intraday all-time high.
-
Channel Resistance ($4419.64): If Gold enters “blue sky” territory above the all-time high, the focus shifts to the topside channel trendline visible on the daily chart. This dynamic resistance currently comes in near $4419.64 and is rising each day.
The Bearish Scenario: What Would Turn the Tide?
Despite the bullish momentum, traders must manage their risk. The 100-hour moving average, now rising to approximately $4301, remains the critical line in the sand.
For sellers to claim a victory and shift the short-term bias, they must push the price back down to—and through—this moving average. A sustained break below $4301 would encourage further downside probing, exposing the 200-hour moving average (the green line on the chart), which is currently rising at $4254.19.
Conclusion: Buyers Maintain Control
Overall, the technical narrative is clear: Sellers had their opportunity yesterday during the dip to the 100-hour moving average, but they failed to capitalize. By holding that support, buyers have reaffirmed their control. As long as that support holds, the market’s eyes remain locked on the all-time high levels ahead.


Leave a Reply