
S&P 500 Technical Analysis with Order Flow Deep Dive
The S&P 500 is entering a critical decision zone after a sharp selloff earlier in the week and a subsequent stabilization that has started to shift short-term market dynamics. While it is too early to declare a confirmed bullish reversal, recent order flow behavior suggests that downside momentum has weakened and that buyers are beginning to reassert influence at key levels.
This analysis combines price structure, value-area behavior, and orderFlow Intel insights to assess what needs to happen next for bulls or bears to regain control. But let’s start with my technical analysis video. Remember when Trump crashed the market (temporarily) with his big tarrif news in April this year? I bet you do. That is a key pivot point that started an key trend line, as I show below:
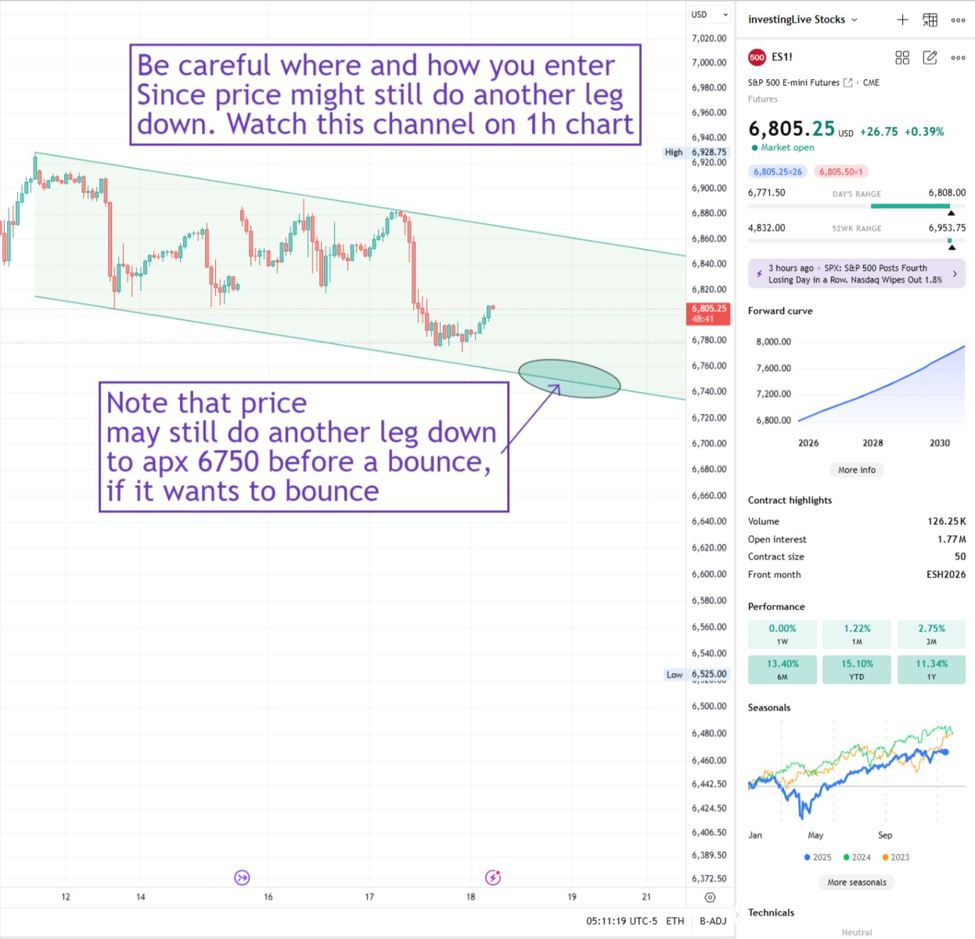
Caution Advised: S&P 500 May Revisit 6750 Before Bouncing
The below 1-hour chart of the S&P 500 E-mini Futures (ES1!) highlights a distinct descending channel, suggesting that traders should be patient with their entries as the short-term trend remains bearish. Although the price is currently hovering around 6,805, the analysis warns of a potential continuation downward to test the channel’s lower support boundary. Specifically, the chart points to a target area near 6,750 (highlighted by the green oval) where the price might find a floor; but we do not know if it will get there. Still, this channel on the 1hr timeframe can also be a guide going forward.
S&P500 1hr chart with a note to be careful
What Changed After the Recent S&P 500 Selloff
Earlier sessions saw the S&P 500 grind lower with value migrating down and the Point of Control (POC) developing near the lower end of the value area. That behavior reflected seller acceptance rather than panic, a common feature of professional distribution.
However, the most recent futures session introduced a notable shift:
-
Price briefly broke below yesterday’s Value Area Low near 6775.5, but failed to find acceptance.
-
Buyers responded quickly, reclaiming that level and pushing price back into value.
-
Over time, value stopped moving lower and began rebuilding higher.
-
The developing POC lifted from the lower edge of value toward the upper half.
This sequence does not confirm a bullish reversal on its own, but it does signal that the prior bearish auction may have completed its work.
Early Signs That a Bullish Reversal Is Possible for S&P 500
From an order flow perspective, several constructive developments stand out:
-
Repeated buyer responses produced actual price relocation, not just short-lived bounces.
-
Pullbacks remained shallow and were defended above 6785 to 6787, an area that aligns closely with VWAP and recent balance.
-
On higher intraday ranges, value began to stabilize and migrate upward rather than continue drifting lower.
As long as price holds above this zone, the market is no longer behaving like a one-directional selloff. Instead, it is transitioning into a balanced-to-upside exploratory phase.
My S&P 500 Tehcnical Analysis Shows Key Levels Bulls Need to Defend
For the bullish case to remain valid, traders should monitor the following levels closely:
-
6785 to 6787
This area acts as a short-term value pivot. Sustained trade above it suggests buyers remain in control of the auction. -
6790 to 6792
This zone represents a cluster of developing value and prior resistance. Acceptance above it would increase confidence that a broader upside rotation is underway. -
6800 to 6810
If the market gains acceptance above the upper value zone, this becomes the next natural area for price exploration.
A bullish reversal thesis strengthens only if pullbacks continue to hold above VWAP and value builds higher rather than slipping back toward prior lows.
Why a Bullish Reversal Is Not Guaranteed
Despite these improving signals, it is important to stay balanced.
The market has not yet demonstrated a full higher-timeframe trend reversal. Several risks remain:
-
If price fails to hold above 6785 and rotates back below VWAP, the recent upside may prove to be corrective rather than structural.
-
A return to 6775.5 or lower, especially with expanding sell volume, would suggest that sellers are regaining acceptance.
-
Without sustained acceptance above 6792, upside attempts may continue to stall into resistance.
In other words, the burden of proof still rests with buyers. Early signs are constructive, but confirmation requires follow-through.
What S&P 500 Traders and Investors Should Watch Next
In the near term, the most important question is whether value continues to build higher or slips back into the lower range.
-
Bullish scenario:
Price holds above 6785, acceptance develops above 6792, and pullbacks remain shallow. This would support a broader recovery attempt. -
Bearish scenario:
Price loses VWAP, acceptance forms below 6775.5, and value begins migrating lower again. That would argue the downtrend is resuming.
Until one of these scenarios clearly resolves, patience and disciplined risk management remain essential.
This S&P 500 technical analysis highlights a market at an inflection point. Order flow shows that sellers have lost momentum and that buyers are beginning to influence price again, opening the door to a potential bullish reversal. At the same time, the structure is not yet strong enough to declare a trend change with confidence.
For now, the S&P 500 remains in a transition phase where confirmation matters more than prediction. Traders and investors should stay focused on how price behaves around key value levels, letting structure and acceptance guide the next decision.
Decision support only. Trade the S&P 500 at your own risk.


Leave a Reply