
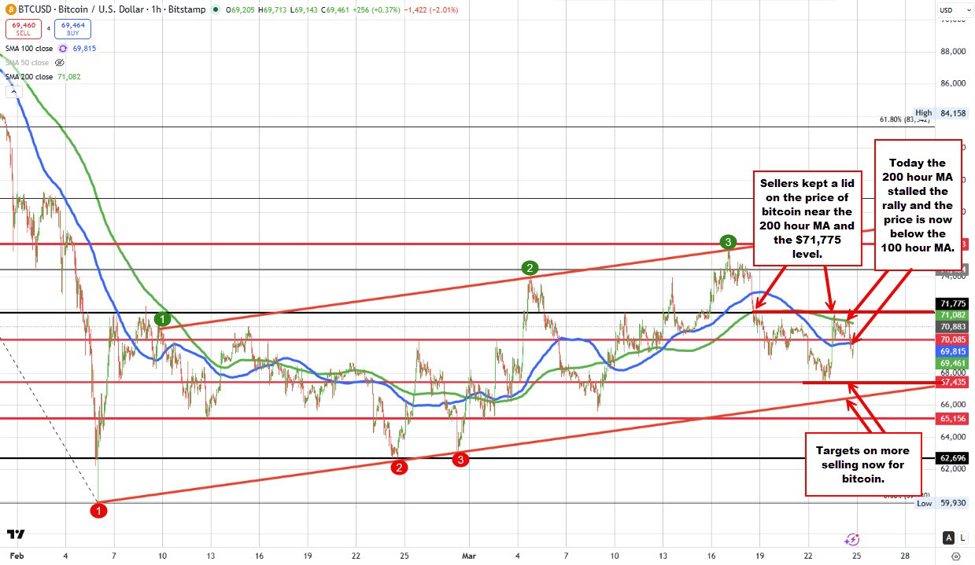
The price of Bitcoin is trading lower on the day and has moved back below its key moving averages — the 200-hour MA at $71,082 and the 100-hour MA at $69,815. These levels have been important barometers for buyers and sellers going back to February, with the price oscillating above and below them as the market searches for direction.
More recently, after breaking higher on March 9, the price reversed back lower on March 18, reinforcing the idea that rallies toward the 200-hour MA are attracting sellers. Yesterday, the price briefly pushed above that level but stalled against resistance from the March 18 highs, leading to a rotation lower. Today followed a similar script — another test of the 200-hour MA, and once again, sellers leaned.
Over the last several hours, selling pressure has become more directional, with the price now breaking below the 100-hour MA at $69,815. That shift increases downside risk. If sellers can keep the price below the 100-hour MA — and away from the 200-hour MA above — it strengthens the bearish bias and opens the door for further downside momentum.
On the topside, the 100-hour MA near $69,815 and the 200-hour MA at $71,082 (and falling) now serve as key risk-defining levels. Staying below those levels keeps sellers in control.
On the downside, traders will target the recent low near $67,400 as the next key support. A break below that level would increase bearish momentum and shift focus toward the lower channel trendline near $62,000.
What next?
If the price stays below the 100- and 200-hour moving averages, sellers remain in control with downside targets in focus. Move back above those levels, and the bias starts to shift back toward the buyers.


Leave a Reply