


- Prior month employment change: 75.1K
Details for the month of August:
- Employment change: -41.7K vs +15.0K expected; prior +75.1K
- Unemployment rate: 6.4% vs 6.4% expected; prior 6.4%
- Full-time employment change: -35.9K vs prior +38.6K
- Part-time employment change: -5.8K vs prior +36.6K
- Participation rate: 65.0% vs prior 65.1%
- Average hourly wages for permanent employees: +2.0% YoY vs +3.0% expected; prior +3.0%
The Canada employment report for August was weaker than expected. Employment fell by 41.7K, well below the expected gain of 15.0K, with losses in both full-time and part-time positions. Full-time employment declined by 35.9K, while part-time employment fell by 5.8K.
Despite the decline in employment, the unemployment rate remained unchanged at 6.4%, matching expectations. That was partly explained by the participation rate slipping to 65.0% from 65.1%, meaning fewer people were actively participating in the labor force.
Wage growth also cooled sharply. Average hourly wages for permanent employees increased by just 2.0% from a year earlier, down from 3.0% in the prior month and below the 3.0% estimate. Overall, the report points to a softer Canadian labor market, with falling employment, weaker labor-force participation and easing wage pressures. That combination should reduce pressure on the Bank of Canada to tighten policy further and is a negative input for the Canadian dollar.
As a caveat, the 42,000 decline in August employment followed several months of solid job creation. Employment increased by a cumulative 181,000 from April through July and remained 217,000—or 1.0%—higher than a year earlier. The employment rate—the proportion of the population aged 15 and older who are employed—decreased by 0.1 percentage points to 60.8% in August. The employment rate in August was on par with the rate recorded at the start of the year, and up 0.3 percentage points compared with August 2025. The August weakness was also concentrated partly in the public sector, where employment fell by 20,000 for a third consecutive monthly decline, while private-sector employment was little changed and remained higher year over year. Therefore, although the August report was clearly weak, one month does not yet establish a broader deterioration in Canada’s labor market.
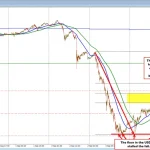
Technically, the combination of a weaker Canadian employment report and a stronger US jobs report has sent the USDCAD sharply higher. The fundamental story is supportive of the move: softer Canadian data weakens the CAD, while stronger US data supports the USD.
The rally has also produced an important technical shift. The price has moved back above its 200-day moving average at 1.3836, followed by breaks above the 100-hour moving average at 1.3850 and the 200-hour moving average at 1.38587. Moving above all three levels increases the bullish bias and gives buyers greater control.
The next key target is the 38.2% retracement of the decline from the late-July high at 1.3882. A sustained break above that level would open the door toward 1.39079, followed by the 100-day moving average at 1.3919. The downward sloping trend line on the chart above is getting closer to the 100 day MA, which would increase that levels importance going forward. Getting to that level/target is not likely today, but traders need to keep the “road ahead” in mind at all times.
For traders, identifying risk is just as important as identifying targets. The 200-day moving average at 1.3836 is now the key risk-defining level. Buyers would not want to see the price move back below—and stay below—that moving average. If it does, the breakout would begin to look like a failed move, and some of the post-employment-report buyers could turn back into sellers. As long as the price remains above that level, however, the buyers maintain the stronger technical hand.




Leave a Reply