

Last updated: September 2, 2026
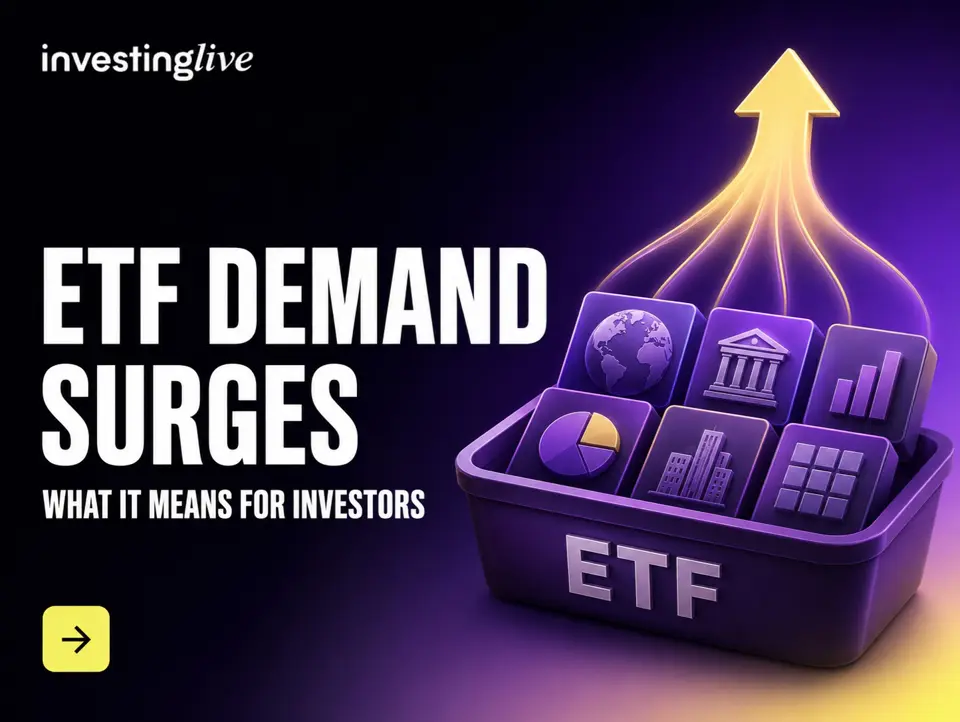
Today I was looking at the latest data that confirms that ETF demand is not only rising, but accelerating. Global ETF and related ETP net inflows reached a record $1.71 trillion in the first seven months of 2026, while Europe and active ETFs also set records. The shift points to demand for lower-cost, flexible portfolio tools, but it does not automatically mean investors are well diversified. Let’s check out what we can learn from this trend.
Key takeaways for young investors
-
The trend is real: Global ETF and ETP inflows through July 2026 were the highest on record and far ahead of the same period in 2025.
-
Diversification is an important motive: Many investors use ETFs to spread money across companies, countries, sectors or asset classes without buying every holding separately.
-
This is not only a passive-investing story: Actively managed ETFs are also attracting record amounts of money.
-
An ETF is a wrapper, not a risk rating: A broad global equity ETF can be diversified, while a technology, leveraged or single-stock ETF can be highly concentrated.
-
Flows are clues, not forecasts: Inflows can reveal where demand is building, but they do not tell us that an ETF or its underlying market must rise next.
Are investors really moving more money into ETFs?
Yes. In fact, calling this an emerging trend may be too cautious. ETF adoption has been developing for years, and the 2026 figures show that it is accelerating.
Global ETF and ETP demand
ETFGI reported that global assets reached a record $23.11 trillion at the end of July 2026. Net inflows totaled $1.71 trillion during the first seven months of the year, compared with $1.09 trillion over the same period in 2025 and $944.18 billion in 2024. July was also the industry’s 86th consecutive month of net inflows. ETFGI global ETF and ETP data
European ETF demand
Europe is participating in the same shift. European ETF assets reached a record $3.80 trillion, while net inflows through July climbed to $323.59 billion. That compares with $207.28 billion during the same period in 2025 and $127.19 billion in 2024. ETFGI European ETF data
Active ETF demand
The active ETF market reached $2.59 trillion in assets at the end of July. It attracted a record $590.46 billion in 2026 net inflows through July, up from $322.69 billion during the same period in 2025. Active ETFs have now recorded 76 consecutive months of inflows. ETFGI active ETF data
Latest US weekly reading
The positive direction continued into August. The Investment Company Institute estimated $32.04 billion of US ETF net issuance for the week ended August 26, with equity, bond and commodity ETFs all receiving net inflows. Weekly figures are estimates and can be revised, so they are best treated as a current snapshot rather than the main proof of the long-term trend. ICI weekly ETF net issuance
Data note: ETFGI’s global totals include ETFs and closely related exchange-traded products, or ETPs. ICI uses its own US ETF universe. Their totals should not be added together, but both datasets point in the same direction.
What is an ETF, in simple terms?
An exchange-traded fund, or ETF, is a pooled investment product. It collects money from many investors and uses that money to hold a portfolio of assets. Investors can buy or sell ETF shares on an exchange during the trading day, much like shares of a company.
One ETF might hold hundreds or thousands of global stocks. Another may hold government bonds. A third may track gold, a single sector, a cryptocurrency-related asset or one highly specialized strategy.
This is why the word “ETF” tells you how the product is packaged and traded, but not whether it is broad, concentrated, cautious or risky.
What do ETF inflows and outflows actually mean?
An ETF inflow occurs when the value of new ETF shares created is greater than the value of shares redeemed. An outflow means redemptions are greater than creations.
That is different from ordinary trading volume. When one investor sells an existing ETF share to another investor on an exchange, ownership changes, but no new money necessarily enters the fund. The ICI reported that 88% of ETF activity in 2025 took place in the secondary market, where investors generally traded existing ETF shares with one another. ICI 2026 Investment Company Fact Book
A useful mental model is:
Change in ETF assets = net flows + investment gains or losses, with smaller adjustments for items such as currency movements.
July 2026 provides a good example. ICI data showed that US ETF shares issued exceeded shares redeemed by $188.93 billion, yet total ETF assets declined by 0.2% during the month. Fresh money entered, but market movements more than offset it. ICI monthly ETF data for July 2026
That distinction matters. A record asset total can partly reflect rising markets, while record net inflows provide clearer evidence that investors are adding capital.
Why are more investors choosing ETFs?
1. Diversification can be easier
Buying one broad ETF can give an investor exposure to many companies in a single transaction. It can reduce dependence on the success or failure of one company, although it cannot remove the risk of the market itself falling.
US household research from ICI found that diversification and cost effectiveness were among the most widely cited reasons for owning ETFs. Saving for retirement was also a goal for 79% of ETF-owning households in 2025. This suggests that ETFs are being used as long-term portfolio building blocks, not only as short-term trading tools. ICI 2026 Investment Company Fact Book
2. Investors are paying closer attention to costs
Many broad index ETFs charge relatively low annual fees. Competition has also pushed costs down. ICI found that the asset-weighted average expense ratio for equity ETFs fell from 0.28% in 2005 to 0.16% in 2024, while the bond ETF average fell from 0.21% in 2007 to 0.14% in 2024. ICI research on ETFs and their investors
Small fee differences can become meaningful over many years because fees reduce the money that remains invested and able to compound.
3. ETFs make portfolio changes more convenient
ETFs trade throughout the day, often have low entry amounts and may be available in fractional shares. They can be used to add or reduce exposure to a market without trading every underlying security.
That flexibility attracts more than individual investors. Institutions may use ETFs for liquidity, hedging or temporary market exposure, while financial advisers increasingly use them in model portfolios. Therefore, a large inflow should not automatically be described as young retail investors buying the market.
4. The ETF format now carries both passive and active strategies
An index ETF follows a set benchmark. An active ETF gives a manager discretion to select and adjust holdings within the fund’s stated rules.
Record active ETF inflows show that investors are not simply rejecting professional management. Many appear to like the ETF format itself, including its tradability, transparency and, in some markets, potential tax advantages, while still choosing active decision-making inside the fund.
This is one of the most important lessons from the 2026 data: the growth of ETFs is increasingly a change in investment packaging, not just a vote for passive investing.
Does rising ETF demand mean investors are becoming more diversified?
Partly, but not automatically.
A broad-market ETF
An ETF holding hundreds of companies across several industries can reduce company-specific risk. A global version may also reduce dependence on one country.
A sector or theme ETF
An ETF focused on artificial intelligence, clean energy, biotechnology or another theme may own several companies, but those companies can still respond to the same economic driver. The fund may be diversified by name count but concentrated by risk.
A single-stock or leveraged ETF
This can remove the traditional diversification benefit almost completely and may amplify daily gains and losses. US investor regulators warn that leveraged or inverse single-stock ETFs carry greater volatility and risk than holding the underlying share itself. Investor.gov on single-stock ETFs
Several ETFs with overlapping holdings
Owning five ETFs does not guarantee five different sources of return. A US large-cap ETF, a Nasdaq ETF, a technology ETF and an AI ETF may all have large positions in the same small group of companies.
The latest flow mix illustrates the point. BlackRock’s data showed that technology ETPs attracted a record $60.5 billion in July 2026. That is strong demand for an ETF category, but it may represent investors concentrating on a popular theme rather than spreading risk. BlackRock global ETP flows for July 2026
What else can young investors learn from the ETF flow trend?
Investors increasingly build portfolios in separate blocks
Global equity ETFs attracted $772.88 billion through July 2026, while fixed-income ETFs received $314.70 billion. This suggests investors are using ETFs for different jobs: shares for growth, bonds for income or stability, and smaller allocations for commodities or specialized exposures.
Interest is broadening beyond domestic stock markets
European ETF flows are rising rapidly, and ICI found that US net issuance into global and international equity ETFs increased from $97 billion in 2024 to $248 billion in 2025. Performance chasing may explain part of that move, but it also fits a wider effort to reduce home-country concentration.
The industry’s product boom creates a new research problem
ETFGI counted 2,141 ETF launches globally in the first seven months of 2026, alongside 353 closures. More choice can improve access and competition, but it also creates more products with narrow mandates, short histories or limited assets.
Young investors once faced the problem of too little market access. Increasingly, the challenge is choosing carefully from too many similar-looking products.
ETF flows can help read market positioning, but not predict it
Sustained inflows into broad equity ETFs can suggest stronger demand for equity exposure. Bond ETF inflows may point to demand for income or a more defensive allocation. Sector flows can highlight rotation, while international flows can reveal changing regional preferences.
However, ETF flows are backward-looking. They may reflect long-term savings, institutional hedges, model-portfolio rebalancing, performance chasing, tax-related trades or conversions from mutual funds. An inflow into an inverse ETF may even represent a bearish position.
I would therefore use flows as evidence of where capital has been moving, not as a stand-alone instruction about where prices must go next.
Eight checks to make before buying an ETF
1. What job will it do?
Decide whether the ETF is a core long-term holding, a diversifier or a smaller tactical position.
2. What does it actually own?
Read the objective, index methodology and current holdings. The product name alone is not enough.
3. How concentrated is it?
Check the largest holdings, sector weights, country weights and dependence on one investment theme.
4. Does it overlap with funds you already own?
Different ETF names can hide many of the same underlying companies.
5. What is the full cost?
Look beyond the expense ratio. Consider the bid-ask spread, brokerage charges and how closely the ETF has tracked its benchmark. Investor.gov describes the spread as a hidden trading cost that can be larger in less-liquid ETFs. Investor.gov ETF bulletin
6. Is the product large and liquid enough?
Smaller funds can have wider spreads and a greater chance of being closed or merged. Closure does not normally make the assets disappear, but it can force an exit at an inconvenient time.
7. Is it a conventional ETF or a complex product?
Check for words such as leveraged, inverse, daily, single-stock or note. These products can behave very differently from a broad index ETF.
8. Do the domicile, currency exposure and tax rules suit you?
These details vary by country. The currency in which an ETF trades is also not necessarily the same as the currency risk inside its holdings.
You can also put up the ETF on a simple daily chart, without deeply going into “technical analysis”, here’s my super simple tip for ETF buyers
The VanEck Semiconductor ETF (SMH) serves as the primary benchmark for the chip industry, offering concentrated exposure to leading global designers, foundries, and equipment manufacturers. On the daily timeframe, the 20-day exponential moving average (20 EMA) functions as a straightforward momentum filter, where price holding below the line reflects short-term bearish pressure and a reclaim above it signals bullish control. Traders also monitor the slope and curvature of the average to gauge whether directional momentum is actively accelerating or flattening out into consolidation.
(Quick note on conventional technical analysis: trend-following frameworks treat price below the moving average as bearish and above as bullish. If your intended angle is contrarian mean-reversion—viewing extended moves above as overbought/bearish and dips below as oversold/bullish—the phrasing in sentence two can be inverted to highlight fading overstretched price action.)
Are ETFs safer than individual stocks?
A broad ETF can reduce the damage caused by one company failing, but it still carries market risk. A stock ETF can fall when stocks fall, a bond ETF can lose value when rates or credit conditions change, and a specialized ETF can be more volatile than a broad index.
Can one ETF create a fully diversified portfolio?
It can provide broad diversification within its chosen universe. A global stock ETF may spread exposure across many companies and countries, for example. It does not automatically diversify an investor across stocks, bonds, cash and other asset classes, or match every person’s time horizon and risk capacity.
Are strong ETF inflows a buy signal?
No. Inflows confirm demand that has already occurred. They can support an investment thesis, but prices may already reflect that demand, and the flows may reverse. The underlying holdings, valuation, risk and the investor’s time horizon still matter.
What should investors take from the ETF boom?
The strongest conclusion is not simply that ETFs are popular. It is that investors increasingly want portfolios that can be assembled from transparent, tradable building blocks. Broad funds make diversification easier, bond and international ETFs widen the available toolkit, and active ETFs show that the format is expanding beyond passive index tracking.
But convenience creates its own trap. It has never been easier to buy a fund, and it has also never been easier to buy a highly concentrated idea without fully understanding it.
For young investors, the useful habit is simple: look through the ETF, not just at its ticker or name. Understand what it owns, what risks are repeated elsewhere in the portfolio, what it costs and why it belongs in the plan.
ETF popularity is a meaningful structural change in investing. Whether that change improves an individual portfolio still depends on the choices made inside the wrapper.
Investing involves risk, including possible loss of capital. Diversification can reduce some risks, but it cannot eliminate losses or guarantee returns.
Latest from the investingLive Education Hub:



Leave a Reply