

Gold is trading lower today, although it has recovered from its session lows. The metal is currently down around $30 as rising U.S. Treasury yields and a stronger U.S. dollar continue to weigh on prices. The low for the day reached $4,136.70 before rebounding, while the high came in at $4,221.
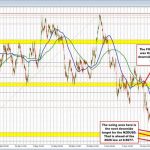
From a technical perspective, gold remains under pressure. On the hourly chart, the price continues to trade below the falling 200-hour moving average, currently at $4,231.55. The 100-hour moving average sits higher at $4,254.65, and both averages are sloping downward, reinforcing the bearish bias. As long as the price remains below these key moving averages, sellers retain the near-term technical advantage.
A move back above the moving averages would shift attention toward the next key resistance zone between $4,350 and $4,375. Buyers would need to reclaim that area to wrestle more control away from sellers.
On the downside, Friday’s low near $4,120 remains an important support level. A break below that level would open the door for a test of the June 10 low at $4,023.95.
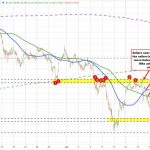
Looking at the daily chart, gold fell below its 200-day moving average on June 5 and has remained beneath that key long-term indicator ever since. The 200-day moving average is currently at $4,443.34 and continues to rise. Notably, the break below the 200-day moving average was the first such breach since October 2023, highlighting the significance of the recent deterioration in the longer-term technical picture.


Leave a Reply