
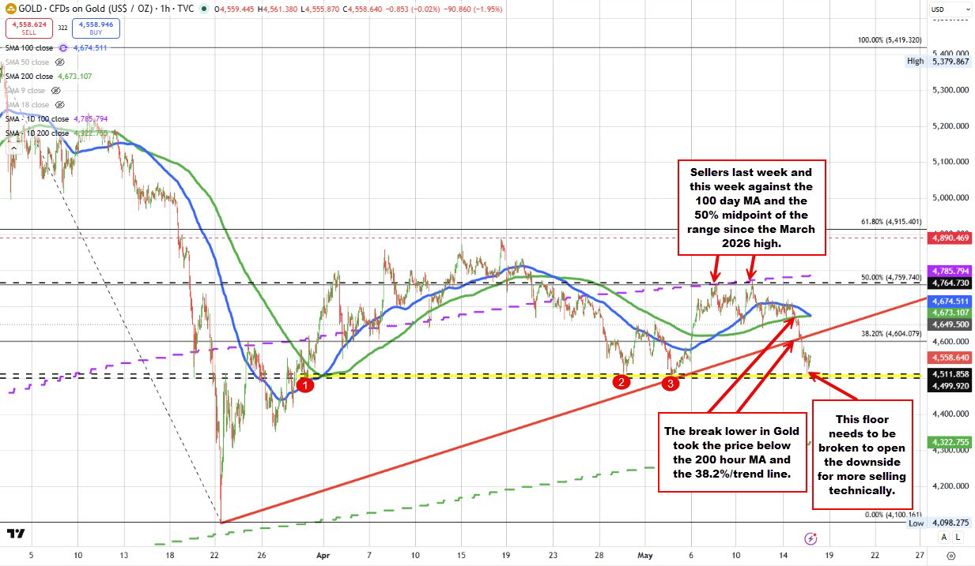
The price of gold is breaking sharply to the downside today after volatile, back-and-forth trading for much of the week. Looking back to last week and into Monday’s trade, rallies repeatedly stalled near the $4,760 area. That level was technically significant, marking the 50% midpoint of the decline from the March high to the March low, while also coinciding closely with the 100-day moving average. The inability to break and stay above those key resistance levels gave sellers the green light to reassert control, leading to renewed downside pressure at the start of the trading week.
Initially, the decline found support near the 200-hour moving average, which helped stabilize the market and slow the fall through much of Tuesday’s trade. However, that support gave way yesterday as sellers pushed the price below the moving average with stronger downside momentum. That bearish momentum has accelerated further today, with gold currently down roughly $90, or -1.93%, near $4,560. The low price reached $4,511.54.
Importantly, today’s decline tested a key support zone defined by the swing lows from late April and early May between $4,500 and $4,512. The session low reached directly into that area, where buyers stepped in to slow the decline. That makes the $4,500 level a critical technical barometer going forward. A sustained move below that level would increase the bearish bias and likely trigger another wave of selling pressure.
On the topside, resistance is now seen between $4,600 and $4,610. That zone includes the broken 38.2% retracement of the rally from the March low, along with the underside of a previously broken trendline connecting the March and early May lows. As long as the price remains below that resistance area, sellers maintain the technical advantage and remain more firmly in control.
If the $4,500 support floor gives way, traders could begin targeting the rising 200-day moving average near $4,322 as the next major downside objective. For now, sellers are clearly in control, but the market has at least found temporary support near the prior April and May lows, helping to slow the latest leg lower.
The video above shows and talks through the trade and the technicals for the price of Gold currently.


Leave a Reply