

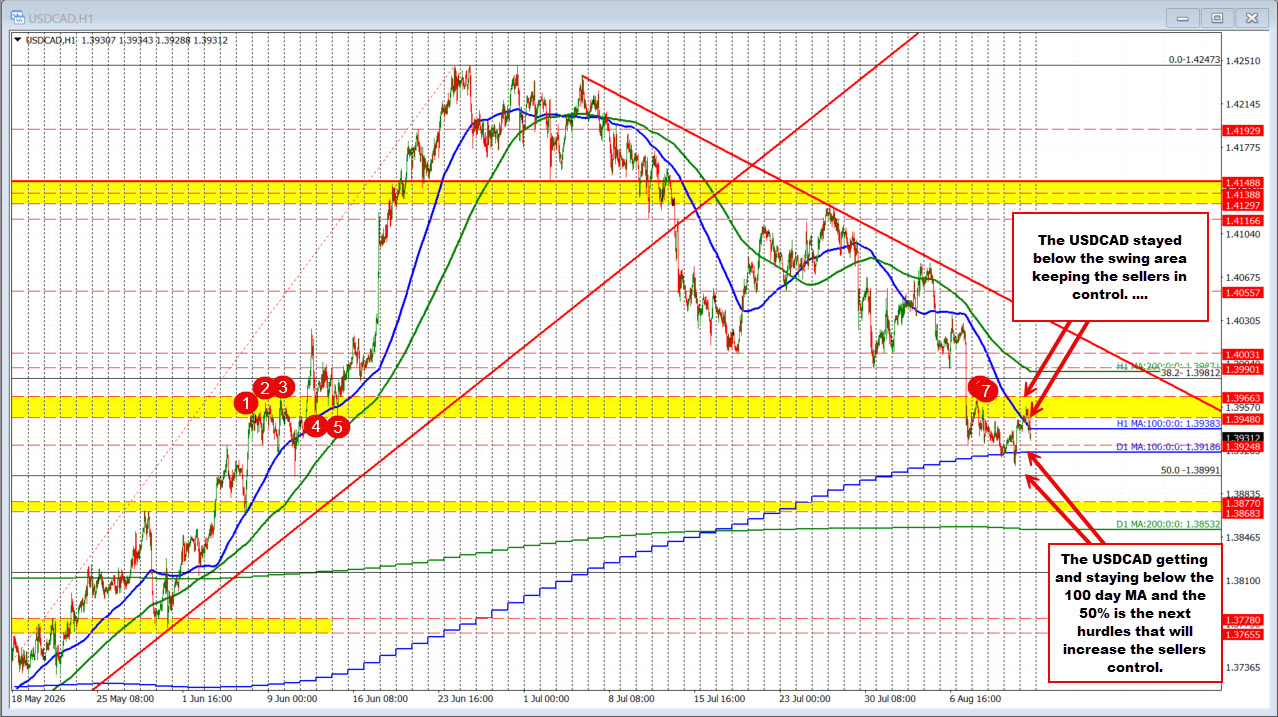
The USDCAD moved lower yesterday, with sellers able to push the pair below its 100-day moving average, currently at 1.39186. That break gave sellers an opportunity to take greater control from a longer-term technical perspective. However, the downside momentum could not be sustained. The price quickly snapped back higher and moved into the close toward its falling 100-hour moving average and a key swing area between 1.3948 and 1.3966.
In trading today, buyers made another attempt to wrestle back some control. The price moved above the falling 100-hour moving average and extended into the 1.3948 to 1.3966 swing area. However, that push ultimately failed. Sellers leaned against the resistance zone, stalled the advance, and turned the price back to the downside.
In early North American trading, the USDCAD has now moved back below the falling 100-hour moving average, currently at 1.39383. That shifts the short-term technical bias more firmly in favor of the sellers and puts the focus once again on the 100-day moving average at 1.39186.
That 100-day moving average remains the key technical hurdle for sellers. Yesterday, they were able to break below it, but they could not keep the price there. As a result, getting below the level is not enough. Sellers need to get and stay below the 100-day moving average to increase the bearish conviction and open the door for another leg to the downside.
If that can be accomplished, the next targets would come near the 1.3900 natural support level and the 50% midpoint of the broader move. Getting below those levels would further strengthen the bearish technical picture and give sellers even more control.
For now, the sellers are holding the strongest hand. They defended the 1.3948–1.3966 swing area, pushed the price back below the falling 100-hour moving average, and have the 100-day moving average back in their sights. However, to play that hand with greater confidence, they still need to break and stay below 1.39186. Do that, and the door opens for a move through 1.3900 and potentially toward lower targets. Fail again at the 100-day moving average, and buyers may once again be encouraged to step back in.
The July U.S. PPI report came in softer than expected, adding to the evidence that inflation pressures cooled during the month. Headline PPI was unchanged at 0.0% month-over-month, below expectations for a 0.2% increase. On a year-over-year basis, producer prices rose 4.7%, below the 4.9% forecast and down sharply from 5.5% in June.
Core PPI, excluding food and energy, rose 0.2% month-over-month, slightly below the 0.3% estimate. The annual core rate came in at 4.2%, matching expectations but slowing from 4.7% previously. Goods prices fell 0.7% during July, while services prices increased 0.2%.
The takeaway: Combined with yesterday’s relatively benign CPI report, the softer PPI provides another piece of evidence pointing toward a more moderate July PCE inflation reading later this month. That is important because components of both CPI and PPI feed into the Fed’s preferred PCE inflation measure. The initial market reaction was modestly negative for the U.S. dollar as the report reduces some of the pressure on the Fed to tighten policy at the September meeting. The expection for a September hike is down to 32.4%.




Leave a Reply