

As a memorandum of understanding is said to be close but not done as Iran’s supreme leader Khomenei and Pres. Trump have not approved, the markets are still hopeful.
US stocks have moved higher led by the NASDAQ index which is up 0.52%. The S&P index is up 0.43%. The Dow industrial average is up seven points and also on pace for a record close for the day.
Crude oil is up about $0.62 at $89.40, but while off the high price of $92.52.
US yields have moved back into negative territory:
- 2 year yield -1 basis point of 4.022%.
- 5-year yield -2.1 basis points at 4.159%.
- 10 year yield -2.2 basis points at 4.459%
- 30 year yield -2.0 basis points at 4.990%
The benchmark levels of that need to be broken in and stay broken include 4.0% for the two year, 4.5% for the 10 year and 5.0% for the 30 year .
Looking at the USD, the greenback has moved sharply to the downside:
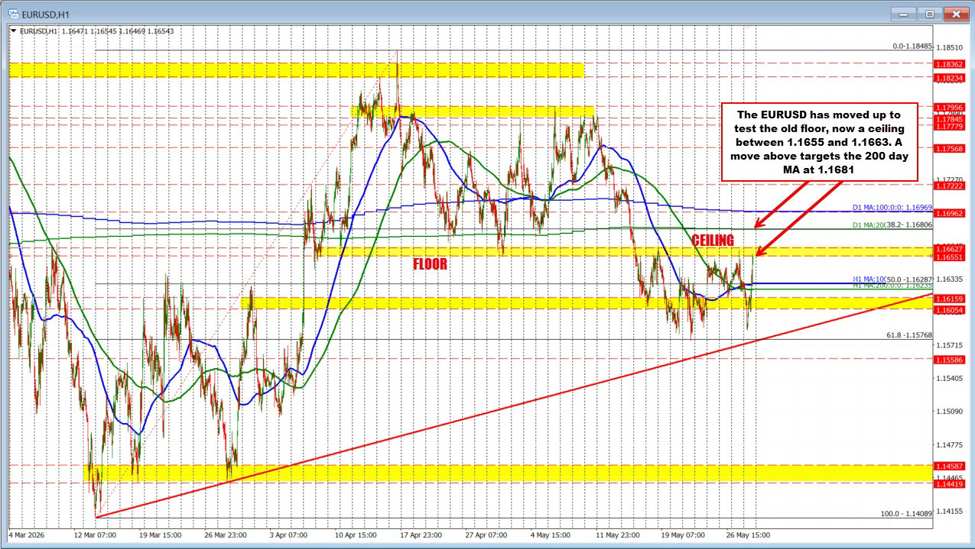
EURUSD: The EURUSD moved back above both the 200-hour moving average at 1.1623 and the 100-hour moving average at 1.1629, shifting the technical bias back to the upside. The break higher has helped push the pair back into a key swing area between 1.1655 and 1.1663 — a zone that previously acted as resistance.
If buyers can extend above 1.1663, the next upside target comes in at the 200-day moving average near 1.1681. Staying above the hourly moving averages keeps the buyers more firmly in control, while a move back below those levels would weaken the bullish momentum.
USDJPY: The USDJPY moved lower and tested the rising 100-hour moving average at 159.19, with the session low reaching 159.19. Also in focus is the 200-hour moving average, currently at 159.09. Buyers leaned against that key support level on Tuesday, helping to keep the broader bullish bias intact.
For sellers to start gaining more control, the price needs to break below — and stay below — the 200-hour moving average. A sustained move under that level would shift the short-term bias more in favor of the downside and open the door toward the next support targets at 158.75 and 158.59.
GBPUSD: GBPUSD buyers have regained control after pushing the price back above the 200-day moving average at 1.3420 and the 200-hour moving average at 1.3433. The momentum has now carried the pair up to the 100-hour moving average at 1.3453 — the next key technical hurdle.
A move above the 100-hour moving average would increase the bullish bias further and have traders targeting the 100-day moving average at 1.3474. Earlier this week, buyers briefly pushed above that key daily moving average, but the breakout failed, leading to a rotation back below the major hourly and daily averages yesterday and earlier today.
Now, traders are trying to flip the bias back to the upside once again, with the cluster of moving averages serving as key barometers for the next move
USDCHF: The USDCHF is trying to navigate through a cluster of key moving averages after the rally stalled just short of the 50% retracement of the move down from the March 31 high to the May low. That midpoint level comes in at 0.7901, and today’s high reached 0.7899 — just two pips shy of the key technical target.
The rejection from that retracement level has sent the pair back lower, with the price now falling below the 200-hour moving average at 0.7861 and the 100-hour moving average at 0.7849. However, sellers have so far stalled just ahead of the critical 100-day moving average at 0.7836, with the session low reaching 0.7842.
If sellers are to take more control, they need to break below — and stay below — that 100-day moving average. Earlier this week, the pair dipped below the level, but sellers could not sustain the momentum. Buyers leaned against the MA on Tuesday, helping to base the pair and fuel the move higher yesterday and into early trading today. That makes the 100-day MA a key barometer for the next directional move.





Leave a Reply